


Introduction
US companies spent $102.8 billion on corporate training in 2025 — a 5% increase year over year, according to Training Magazine's 2025 Industry Report. Yet only 30% of companies use data from their learning programmes to drive business decisions.
Assessing training's impact isn't always easy. But companies that make smart investments in employee growth see their profits jump by 11% and keep twice as many employees. On top of that, companies with complete training programs earn 218% more per employee than those with less reliable training systems.
Success in training comes down to three key questions: Your employees need to learn something valuable. Their job performance should improve. The results must help achieve business goals. A clear picture emerges about what works and what needs fixing once you assess your training's impact.
This article covers seven practical methods to measure training effectiveness — from immediate post-training assessments to long-term ROI analysis — so you can align learning investment with business outcomes. These measurement approaches will help line up your training plans with business goals, whether you need to justify your budget or make your programs better.
Kirkpatrick’s Four Levels of Evaluation
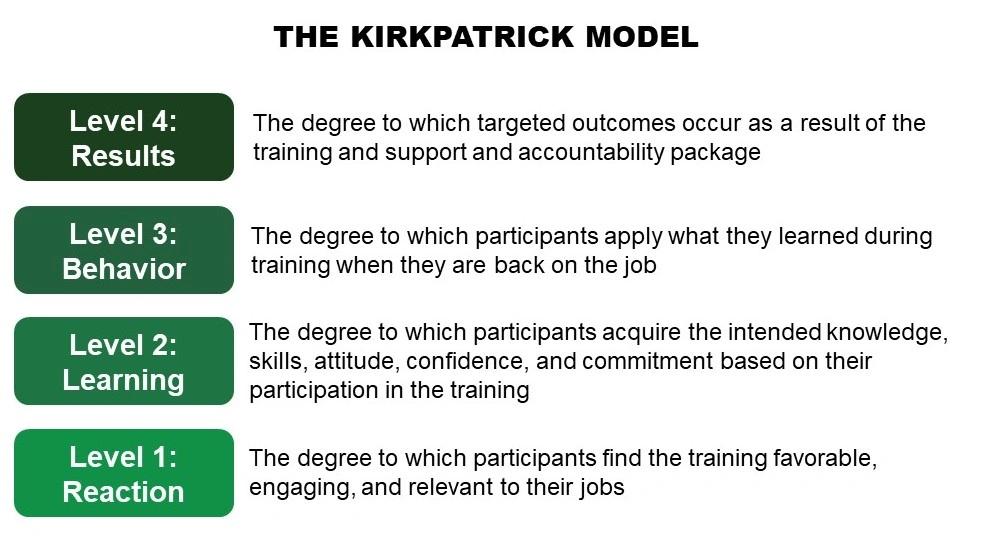
Image Source: Kirkpatrick Partners
The Kirkpatrick Model has been the most widely used training evaluation framework since its development in 1959. Despite decades of newer frameworks emerging, this four-level approach remains the industry standard for organisations measuring training effectiveness systematically.
Kirkpatrick model overview
The Kirkpatrick Model reviews training through four progressive levels. Each level gives deeper analytical insights into how training affects outcomes:
Level 1: Reaction - This level shows how participants feel about their training experience. It captures immediate feedback on content relevance, instructor effectiveness, and overall satisfaction. Most organizations collect this data through post-training surveys or feedback forms.
Level 2: Learning - This level shows what knowledge, skills, or attitudes participants gained during training. It determines whether learning objectives were met through assessments like:
- Pre and post-tests
- Skills demonstrations
- Knowledge checks
- Role-playing exercises
Level 3: Behavior - This level shows how well participants use what they learned at work. It measures actual behavioral change in the workplace through manager observations, performance metrics, or follow-up assessments.
Level 4: Results - This highest level connects training directly to business outcomes like increased productivity, improved quality, reduced costs, or better employee retention.
Kirkpatrick model benefits
Several key advantages explain why the Kirkpatrick Model remains popular:
The model offers a detailed framework that looks at training from multiple angles. Unlike simple approaches that only measure satisfaction, this model captures both immediate reactions and long-term business effects.
Organizations can start with lower levels and build their capacity gradually for more sophisticated evaluation as resources permit, thanks to the hierarchical structure.
The model creates clear accountability by linking training interventions directly to business results. Learning and development professionals can demonstrate their strategic value to the organization through this connection.
The model's widespread use means many resources and case studies are available to organizations of all sizes. Teams across departments and industries can communicate about training effectiveness using its universal language and concepts.
Kirkpatrick model implementation
A successful implementation of the Kirkpatrick Model needs careful planning:
- Begin with the end in mind - Identify desired business results (Level 4) and needed behaviors (Level 3) before designing training. This backward planning helps arrange learning objectives with organizational goals.
- Design integrated evaluation tools - Build complementary measurement approaches for each level:
- Level 1: Engagement surveys with specific questions about content relevance
- Level 2: Knowledge assessments aligned with learning objectives
- Level 3: On-the-job observation checklists or performance indicators
- Level 4: Business metrics tracked before and after training
- Establish evaluation timelines - Levels 1 and 2 happen during or right after training. Levels 3 and 4 need longer timeframes to show results. Plan follow-up evaluations 3-6 months after training.
- Involve stakeholders - Manager participation helps support behavior change and measure application. Their involvement significantly affects Level 3 evaluation success.
- Analyze across levels - Find connections between data at different levels. You can review whether participants who scored higher on Level 2 assessments showed greater behavior change at Level 3.
Organizations should plan evaluation during the training design phase instead of treating it as an afterthought. A well-executed Kirkpatrick evaluation gives applicable information to improve learning initiatives continuously.
Pre- and Post-Training Assessments

Image Source: Training Industry
Pre and post-training assessments are a simple yet powerful way to measure how well training works. This method stands apart from complex evaluation frameworks. It zeros in on measuring actual knowledge and skill improvements from training programs.
Pre- and post-assessment purpose
Pre-training assessments show what participants know and can do before training starts. These original measurements help track real learning progress. Pre-assessments mainly help spot knowledge gaps, pick the right training content, and set starting points for each learner.
Post-training assessments check the same areas after training ends to see what people learned. Looking at both results shows how training changed knowledge and skills. This method answers a key question: "What new knowledge or skills did people gain from the training?"
Organizations use these assessments in several ways:
- To see if learning goals were met
- To find areas that need more teaching
- To confirm if training content works
- To show proof of learning for compliance
- To collect data that improves programs
Pre- and post-assessment benefits
This approach's main strength lies in showing clear proof of training's effect. Research shows good agreement between performance gains from assessments and objective exams. This makes it a great way to show ROI.
Pre and post-assessments boost learner participation by creating what researchers call a "cognitive trigger." Studies show that people who take pre-tests often do better on post-tests than those who don't. The pre-test helps the brain process information better during training.
On top of that, these assessments help create tailored learning paths. Teachers can match content to fill specific knowledge gaps when they know each person's starting point. This focused approach boosts motivation because participants see how it relates to their needs.
From the organization's view, these assessments give great insights about the training program. The data shows which concepts were taught well and which need more time or different teaching methods. This creates an ongoing way to make training better.
Pre- and post-assessment best practices
Organizations should follow key practices to get the most from their training measurements:
First, make sure assessments match learning goals. Include at least one question for each main course goal to get a full picture. This connection gives useful data about the specific knowledge and skills the training aimed to build.
Next, pick the right timing. Research shows that more time between pre- and post-testing makes it easier to show learning gains. Most programs test after 70-100 hours of teaching. Testing should wait until at least 40 hours of instruction passes to get the best results.
Design tests that take 10-25 minutes to finish. Use different types of questions based on what you're measuring. Knowledge checks might use multiple choice, while skill checks might need demonstrations or role-playing.
Tests must prove reliable before becoming official tools. Try questions with small groups first and adjust them based on results to ensure they're clear and accurate.
A complete picture comes from mixing direct and indirect measures. Direct measures include quizzes and demonstrations. Indirect measures include surveys about what people think they learned. This mix gives a better view of how well training works.
The results should drive ongoing improvements. Look at areas with good and poor performance gains to find your training program's strengths and weak spots. This feedback helps you keep making your training better.
Training Analytics and LMS Data
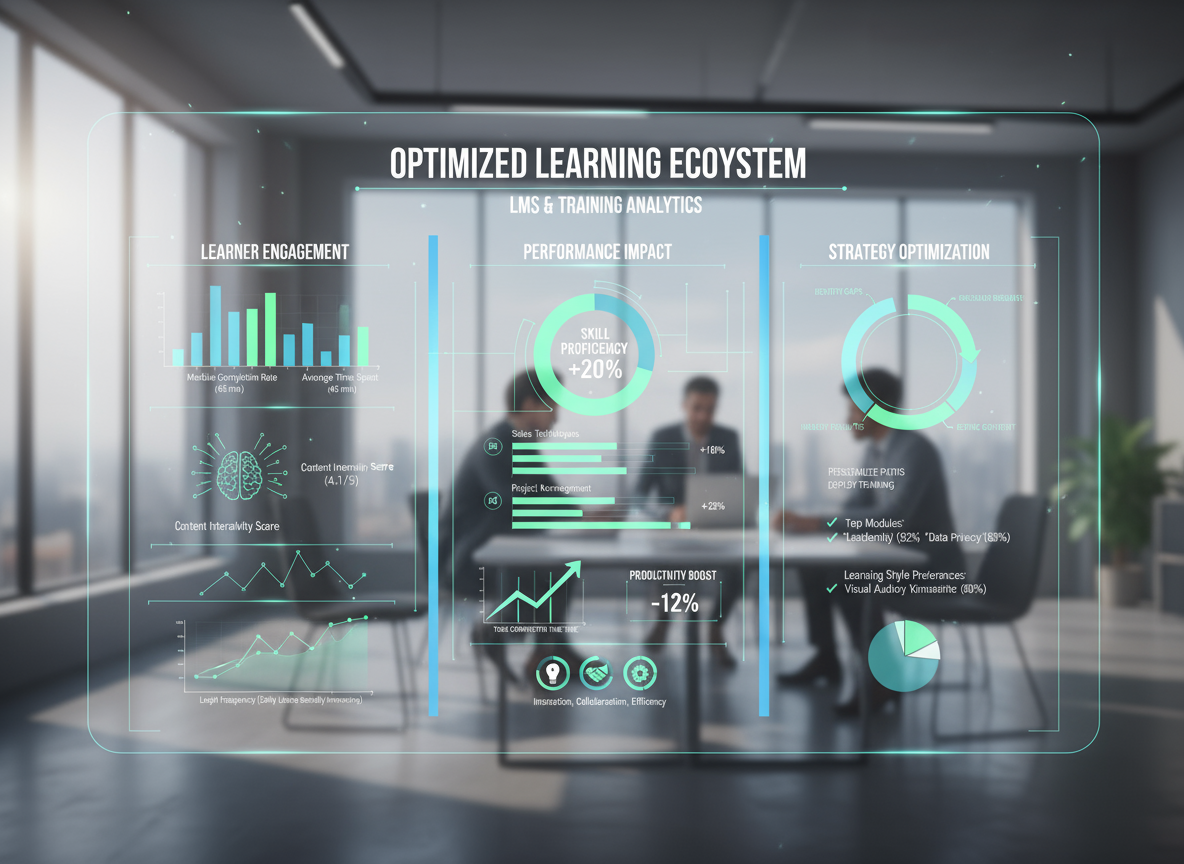
Organizations now rely heavily on Learning Management Systems (LMS) and training analytics to measure and boost their learning programs' effectiveness. Analytics gives a deeper look at how employees interact with training content and how this interaction leads to better performance.
Training analytics definition
Training analytics covers the collection, analysis, and interpretation of data from employee training programs. The process gathers information from multiple sources. Teams clean and prove it right, analyze patterns, and present findings in an available format.
The four core components of learning analytics include:
- Data gathering from LMS platforms, performance management systems, HR platforms, and other repositories
- Data cleaning and validation to ensure accuracy and proper formatting
- Data analysis using programs ranging from Excel to sophisticated statistics tools
- Reporting through available formats that include interpretations and recommendations
Organizations track several types of data:
- Demographic data: Details about trainee characteristics (age, education, experience)
- Behavioral data: Information on how trainees interact with training programs
- Performance data: Results showing training program effectiveness
Training analytics benefits
Smart use of training analytics offers many advantages to organizations looking to get the most from their training investments.
Analytics turns training from a hopeful investment into a proven business driver. Companies that commit to employee development see 11% more profit and keep their employees twice as long. This clear link between training and business results helps learning professionals get executive support for their budgets.
Analytics spots areas where training programs need work. Teams can find weak points in content or drops in learner engagement by tracking metrics regularly. To cite an instance, looking at where people stop helps find content that needs a refresh or complete overhaul.
Analytics creates tailored learning experiences. Organizations can customize content to fill specific knowledge gaps by analyzing each person's performance data. Participants stay motivated because they see how the content relates to their needs.
Analytics proves knowledge transfer works. Tests and quizzes with analytics show whether employees learn and remember content. Training departments can show their value and justify more investment with this data.
Training analytics tools and platforms
A detailed learning platform with built-in analytics helps centralize data collection and reporting. Modern LMS platforms offer sophisticated measurement through detailed tracking and analysis.
Popular analytics tools and platforms include:
- Learning Management Systems (LMS) with analytics like Docebo, Learning Pool, Absorb LMS, and TalentLMS. These systems track learner progress, completion rates, and engagement patterns automatically.
- Data visualization tools like Tableau, PowerBI, and Looker turn complex data into clear insights. These tools connect training data to performance metrics and show training's true impact.
- Experience API (xAPI) captures learning experiences across platforms, not just course completions, offering deeper insights than traditional methods. This approach measures both what people learned and how they use it.
- Dedicated analytics platforms like Watershed offer advanced analytics, especially for organizations needing sophisticated analysis across business units.
These tools should offer features like:
- Optimized reporting
- Customizable dashboards with relevant metrics
- Up-to-the-minute data analysis through integrations
- Predictive modeling for learner performance
Organizations should set clear data goals, pick the right sources, keep data clean, and build an implementation team with leaders and IT specialists. Teams need training to understand and use data metrics to improve programs and plan next steps.
Organizations can move beyond tracking completion rates by using these technologies well. They can evaluate if employees gained knowledge, developed skills, applied their learning, and delivered measurable business results.
Employee Feedback and Surveys

Image Source: Whatfix
Employee feedback gives a great way to get insights into training effectiveness beyond complex analytics and formal assessments. Studies show that 80% of employees who get meaningful feedback during the week stay fully engaged. This makes feedback a valuable tool to assess and improve training programs.
Employee feedback importance
Quantitative metrics show what happened. Employee feedback explains why — revealing what worked, what didn't, and what prevented people from applying their learning. Organizations that listen to their employees and act on their input gain several benefits.
Trainers can improve their teaching methods and course materials when they get up-to-the-minute feedback from participants. This helps them fine-tune their approach to strike a chord with learners while meeting organizational standards.
Organizations can build a valuable collection of insights they can analyze as time goes by. This informed approach helps them spot trends, track learning outcomes, and figure out the ROI of their training programs.
The biggest benefit comes from bridging the gap between training costs and results. Studies reveal that only 12% of employees use their training at work. Feedback helps identify what stops people from applying what they've learned.
Employee feedback collection methods
A complete picture emerges when organizations use multiple ways to collect feedback. Surveys form the backbone of feedback collection, with platforms like Limeade, Qualtrics, and SurveyMonkey leading the way.
Good surveys usually include:
- Closed-ended questions using agreement scales for opinions
- Open-ended questions for detailed explanations
- Rating scales to measure satisfaction levels
- Questions about training relevance and how to use it at work
Focus groups let people dive deeper through guided discussions. These sessions help explore training impact and challenges in more detail. One-on-one interviews create safe spaces for honest feedback about sensitive topics.
Manager observations add valuable insight since they can see actual performance improvements after training. This helps verify if employees use their new skills in ground situations.
Anonymous feedback options like suggestion boxes encourage honest input without worry. Research shows 74% of people would share more feedback if they knew it was truly anonymous.
Employee feedback analysis
Raw feedback becomes useful when analyzed properly. Start by grouping feedback into categories to spot patterns and pick out what needs attention first. This helps learning professionals focus on the most effective improvements.
Looking at patterns over time works better than focusing on single comments. Issues that keep coming up need attention, while one-off opinions might just reflect personal priorities.
A mix of numbers (survey ratings) and stories (written comments) paints the full picture. This all-encompassing approach offers both hard data and deeper understanding.
Watch out for loud voices drowning out quieter ones by getting input from everyone. Strong opinions sometimes overshadow thoughtful feedback that could be just as valuable.
The most significant step is following through. Studies show 37% of people quit their jobs because nobody took their feedback seriously. Show people what you learned and what changes you're making based on their input. This openness proves that feedback matters and keeps people wanting to share their thoughts.
Return on Investment (ROI) Analysis
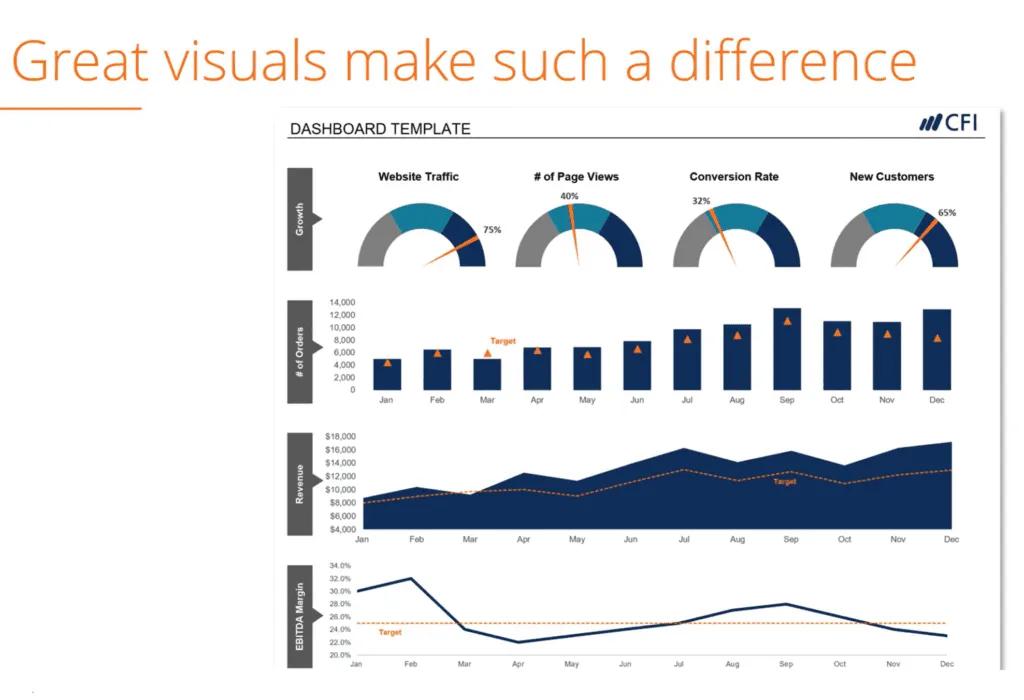
Image Source: Corporate Finance Institute
Organizations can't ignore the need to justify training costs. That's why ROI analysis plays such a vital role in assessing how well training works. Global corporate training spend reached an estimated $400 billion in 2025. With budgets under increasing scrutiny — US corporate training expenditure declined in 2024 for the first time in years — organisations can no longer afford to invest without measuring returns.
ROI in training effectiveness
ROI analysis transforms training from an expense into a strategic investment you can measure. ROI analysis compares measurable gains from training against total investment — converting abstract learning outcomes into financial terms that leadership can evaluate. ROI gives decision-makers solid proof of training's worth, which helps them invest more in learning and development.
ROI analysis shifts the focus from training quality alone to training impact — directly linking learning interventions to performance improvements and business outcomes. Instead of assuming good training leads to learning and results, ROI analysis directly links training to better performance and business outcomes.
Companies measure training ROI to:
- Make smarter decisions about future training investments
- Pick training programs that make the biggest difference
- Show stakeholders what they're getting for their money
But here's the problem - studies show learning programs often don't pay off as expected. Teams don't deal very well with tracking outcomes. Research tells us up to 85% of employee training turns into "scrap learning" - material that never gets used on the job.
ROI calculation methods
The basic ROI formula compares what you get versus what you spend:
ROI (%) = [(Benefits - Costs) / Costs] × 100
This gives you a percentage showing returns on each dollar invested. Take an ROI of 191% - it means for every dollar spent, the company got $1.91 back.
The benefit-to-cost ratio gives us another way to look at it. You divide total benefits by total costs. A 2.91 to 1 ratio means getting $2.91 back for each dollar invested in training.
Before calculating ROI, you need a detailed list of training costs:
- Direct costs (instructor fees, materials, facility rentals)
- Indirect costs (employee time, productivity loss during training)
- Development costs (instructional design, content creation)
The Phillips ROI Methodology adds a fifth level to the Kirkpatrick Model that focuses on financial returns. This method turns training results into actual money by:
- Measuring how much performance improved because of training
- Converting those improvements into dollar values
- Adjusting for bias in self-reporting (usually reducing by 35%)
- Using the standard formula to calculate ROI
ROI limitations and considerations
ROI analysis has its drawbacks when it comes to training. Unlike other business investments, it's hard to pinpoint exactly what training accomplished. Things like company culture and market conditions can affect the same metrics we want to improve through training.
It's easier to add up costs than benefits. This often means we undervalue what training achieves. Measuring soft benefits is particularly tricky. Communication training might do more good than ROI shows, so we might need different ways to assess it.
There's also the timing issue. Benefits sometimes take months to show up, which can throw off ROI calculations. That's why companies should check ROI multiple times during and after training.
Even Jack Phillips admits ROI isn't right for every program. Most experts say to use ROI analysis on just 5% of training programs - the ones that affect business most. For regular training, simpler methods like cost-benefit or break-even analysis work better.
The best approach combines numbers with real feedback. To cite an instance, see the Success Case Method, which gathers compelling stories and case studies instead of just looking at financial metrics.
Behavioral Observation and Application
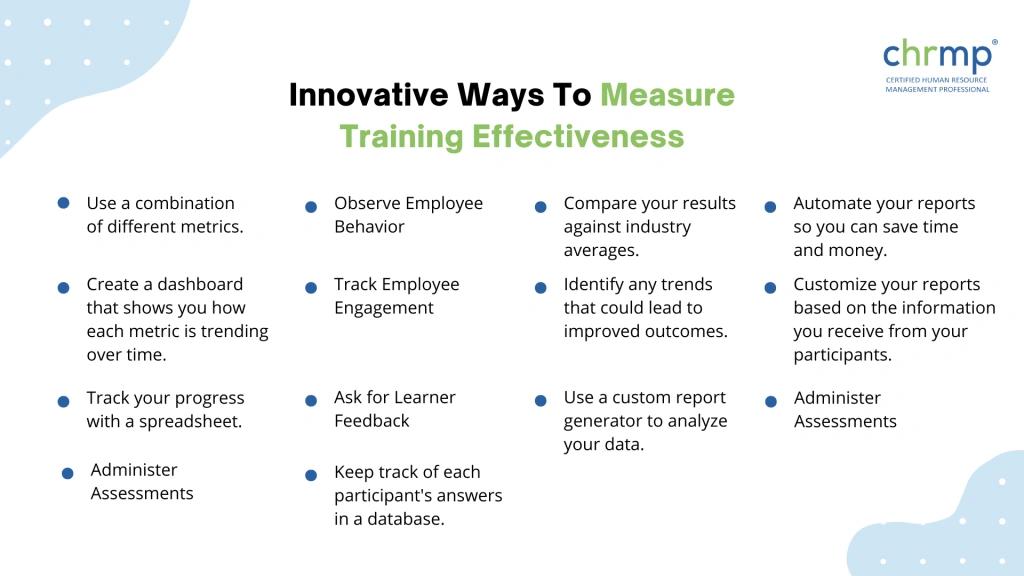
Image Source: CHRMP
The best evidence of training success comes from watching how people change their behavior at work. Behavioral observation methods show how well employees put their training to use in actual workplace settings and demonstrate knowledge transfer.
Behavioral observation techniques
Behavioral observation methods track workplace behaviors systematically. Time-sampling procedures measure behavior frequency at specific intervals and give measurable data about performance improvements. Structured observations use preset categories or checklists to evaluate target behaviors consistently.
Behavioral observation scales (BOS) serve as another effective tool that uses a 5-point frequency scale. The scale ranges from 5 ("almost always") to 1 ("almost never"). This standard approach helps evaluators measure how often employees show desired behaviors in their roles.
The most effective observations should include:
- Direct workplace monitoring
- Written records of behaviors in journals or standard forms
- Multiple observation sessions over time instead of one-time checks
Behavioral observation benefits
Behavioral observation captures essential soft skills that standard tests don't catch. You get a full picture of teamwork, communication, and leadership skills by watching how learners work with others.
This method shows whether training leads to actual behavior changes—the main goal of workplace learning programs. The connection to Kirkpatrick's Level 3 evaluation makes it especially valuable to measure training effectiveness.
The process gives more accurate results than self-reporting, which often suffers from memory gaps or personal bias. You get applicable information from real workplace situations without spending extra money beyond the observer's time.
Behavioral observation challenges
Behavioral observation comes with its share of problems. Observers don't deal very well with attention, focus, and multitasking. They often miss key behaviors even when they're right there watching.
Time creates another hurdle. Good observations take lots of time from skilled observers. Finding unbiased, knowledgeable people who have enough free time is usually tough.
Different observers might see the same behaviors in different ways, which can hurt the reliability of evaluations. Organizations can reduce bias by using standard scoring guides, multiple observers, and proper observer training.
xAPI and Digital Adoption Metrics
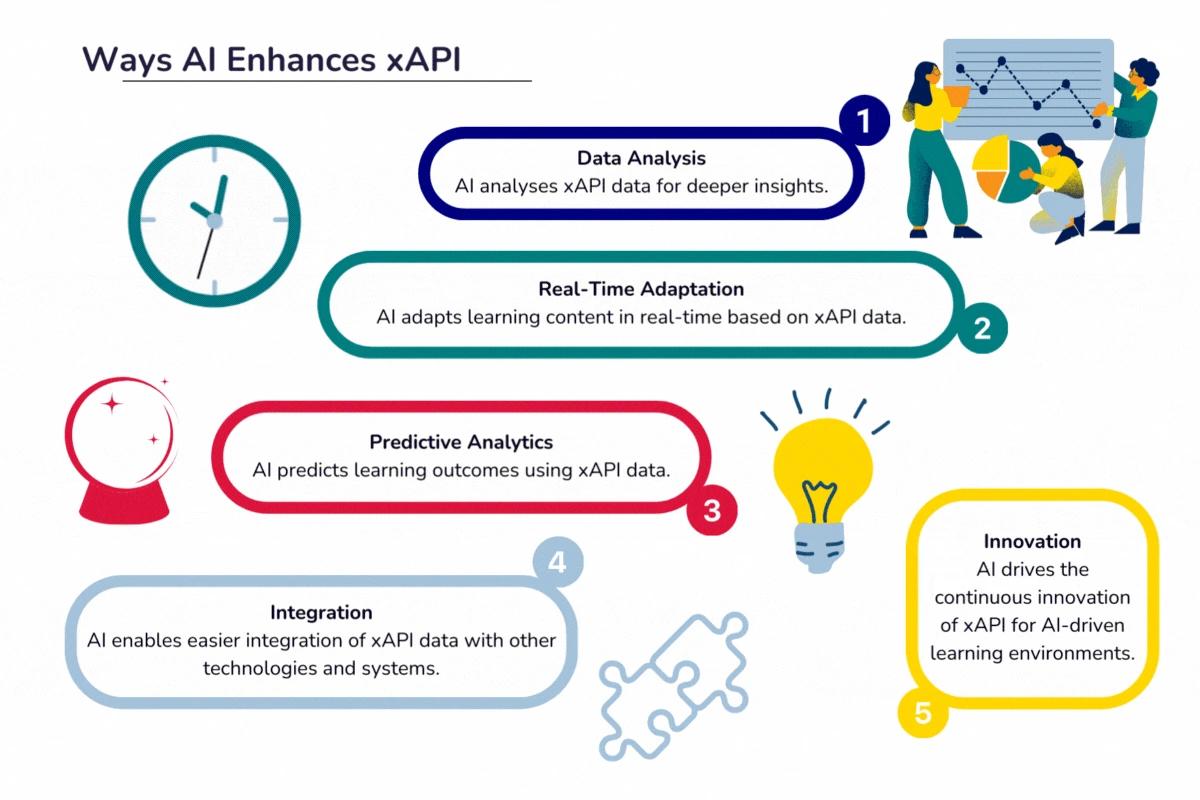
Image Source: Beeline
The Experience API (xAPI) marks a major step forward in how organizations track and assess learning experiences. This IEEE-approved standard (IEEE 9274.1.1-2023), first known as Tin Can API, revolutionizes training measurement by capturing data from both online and offline learning activities.
xAPI overview
xAPI works as a communications protocol that lets different learning technologies share information about learning experiences securely. While older specifications only tracked course completions, xAPI captures detailed data about almost any learning activity.
Two key elements form xAPI's foundation: statements and Learning Record Stores (LRS). Statements follow a simple "[actor] [verb] [object]" structure - basically "I did this". A statement could record "Employee completed safety training" or "Manager watched leadership video".
A Learning Record Store saves these statements, working much like a database in traditional LMS systems. The LRS can exist on its own or within an LMS and share data with other LRSs.
xAPI benefits for training measurement
xAPI changes how we measure learning by tracking experiences beyond standard LMS boundaries. Organizations can now measure:
- Informal learning that makes up about 75% of employee learning
- Mobile learning through dedicated apps instead of just browser content
- Offline activities recorded once connectivity returns
- Ground performance including physical equipment interactions
xAPI gives deeper analytics that show exactly where and how learning happens. L&D teams can use this detailed data to analyze which training content works best and create individual-specific experiences based on each person's priorities and knowledge levels.
xAPI implementation tips
Organizations should set clear measurement goals before collecting data to implement xAPI successfully. This targeted approach prevents information overload and puts quality first.
Start with a pilot group of learners and specific learning activities to track. A successful implementation needs:
- Selecting xAPI-conformant tools and platforms
- Determining specific actions and behaviors to track
- Establishing how to use data to assess and improve training
- Getting the core team from IT, learning design, and management to participate
Digital adoption platforms with xAPI, like Whatfix, give explanations about how users interact with training content and exploit these insights to enhance learning. These platforms show metrics on content usage, user interaction, and help content relevance—key data points to measure overall training effectiveness.
Comparison Table
| Method | Main Goal | Key Components | Main Benefits | Notable Limitations | Implementation Requirements |
|---|---|---|---|---|---|
| Kirkpatrick’s Four Levels | Assess training through multiple dimensions | Level 1 (Reaction), Level 2 (Learning), Level 3 (Behavior), Level 4 (Results) | Detailed framework, easy to implement, clear accountability | Needs long-term follow-up for higher levels | Team involvement, built-in assessment tools, set timelines |
| Pre- and Post-Training Assessments | Track direct knowledge and skill improvements | Pre-training baseline, post-training evaluation | Clear proof of results, supports diagnostic learning | Time gaps between tests matter | Aligned learning goals, confirmed test questions, 40–100 hours between tests |
| Training Analytics & LMS Data | Monitor and study learning involvement | Data gathering, cleaning, analysis, reporting | Shows training’s business value, enables customization | Requires advanced tools and reporting | LMS with analytics, data visualization tools, defined data goals |
| Employee Feedback & Surveys | Collect input on training results | Surveys, focus groups, interviews, supervisor feedback | Immediate insights, connects learning with outcomes | Risk of vocal minority influence | Organized analysis, multiple feedback channels |
| ROI Analysis | Calculate training’s financial effect | Cost calculation, benefit measurement, ROI formula | Shows value, supports data-driven decisions | Hard to measure soft benefits | Cost tracking, review checkpoints, ROI methodology |
| Behavioral Observation | Check real-world training application | Structured observations, behavior scales | Reveals soft skills, proves behavioral change | Time-consuming, observer bias risk | Standard scoring guides, trained observers |
| xAPI & Digital Adoption Metrics | Monitor learning across platforms | Learning Record Store (LRS), digital tracking tools | Tracks casual learning, measures offline work | Needs specialized tools | xAPI-ready platforms, defined measurement goals |
How Hiring Quality Affects Training Effectiveness
Every training effectiveness framework in this article starts from the same assumption: the employee is worth training. But the single most overlooked driver of training effectiveness is whether the hire was right in the first place.
Less than half of workers consistently apply new skills back on the job — and a significant portion of that gap is not a training design problem. It is a hiring accuracy problem. When an employee is mis-hired — placed in a role that doesn't match their actual skills, work style, or cognitive strengths — no amount of training resolves the fundamental misalignment. The result is low Level 3 Kirkpatrick scores, poor ROI, and eventual early exit. Top Echelon
Pre-hire skill assessments that verify role-relevant competencies before the offer reduce this downstream training waste. When employees arrive already validated against the skills the role requires, onboarding is faster, ramp-up time shortens, and training investment lands on employees built to use it.
Conclusion
Organizations need to measure training effectiveness to maximize their L&D investments. This piece explores seven tested approaches that turn abstract training results into measurable outcomes.
Kirkpatrick's Four-Level Model gives organizations the detailed foundation they need to begin their measurement experience. Pre- and post-training assessments show clear evidence of knowledge gains. Modern analytics tools help learn about engagement patterns and learning priorities.
Employee feedback adds a human viewpoint that numbers can't show alone. ROI analysis links training to financial outcomes and justifies future investment in development programs. Behavioral observation shows if learning transfers to workplace performance. xAPI helps track learning on platforms and contexts of all types.
No single measurement approach works perfectly for every training scenario. A mix of quantitative and qualitative methods gives the full picture of training effects. Start with simple approaches like surveys and pre/post assessments. Then move to complex methods like ROI analysis or xAPI implementation.
Measurement changes training from a cost center into a strategic business driver. Organizations that review their training programs can fine-tune their approach. They optimize resources and show clear links between learning initiatives and business goals.
Note that effective measurement starts during training design, not after implementation. Building evaluation into programs from the start will give meaningful data that improves results. Without doubt, organizations that become skilled at training measurement get a competitive edge through better talent development.
Organisations that build measurement into training design — rather than treating it as an afterthought — consistently produce better outcomes, justify their budgets with evidence, and improve programmes faster than those that don't.
Key Takeaways
Organizations that strategically measure training effectiveness can transform their L&D investments from cost centers into proven business drivers, achieving 11% higher profitability and doubled employee retention rates.
• Use Kirkpatrick's Four-Level Model as your foundation - This comprehensive framework evaluates reaction, learning, behavior, and results to provide systematic insights across all training dimensions.
• Implement pre- and post-training assessments for clear evidence - These straightforward tools provide measurable proof of knowledge gains and help identify specific areas needing improvement.
• Leverage LMS analytics to track engagement and personalize learning - Modern training analytics reveal how employees interact with content, enabling data-driven decisions and customized learning paths.
• Combine multiple measurement methods for comprehensive insights - No single approach captures everything; blend quantitative data with qualitative feedback for the most complete understanding of training impact.
• Start measurement planning during training design, not after - Building evaluation mechanisms into programs from the beginning ensures you capture meaningful data that drives continuous improvement and demonstrates ROI.
The key to successful training measurement lies in selecting the right combination of methods based on your specific goals, resources, and organizational needs. Organizations that master this approach gain significant competitive advantages through more effective talent development and can confidently justify their learning investments with concrete evidence of business impact.
Training effectiveness is measured through participant feedback, knowledge improvement, behavioural changes, and business outcomes such as productivity, retention, and ROI. The Kirkpatrick Four-Level Model is one of the most widely used frameworks for evaluating these areas.
The most reliable approach combines pre and post-assessments, manager observations, training analytics, and business performance metrics to create a complete view of learning impact.
Immediate feedback and learning assessments should happen right after training, while behaviour change and business impact are typically measured over 60–180 days depending on programme goals.
Common metrics include completion rates, assessment score improvements, retention rates, manager-rated performance changes, time-to-productivity, employee turnover, and overall training ROI.